Advanced Strategy-Based Chart Analysis System
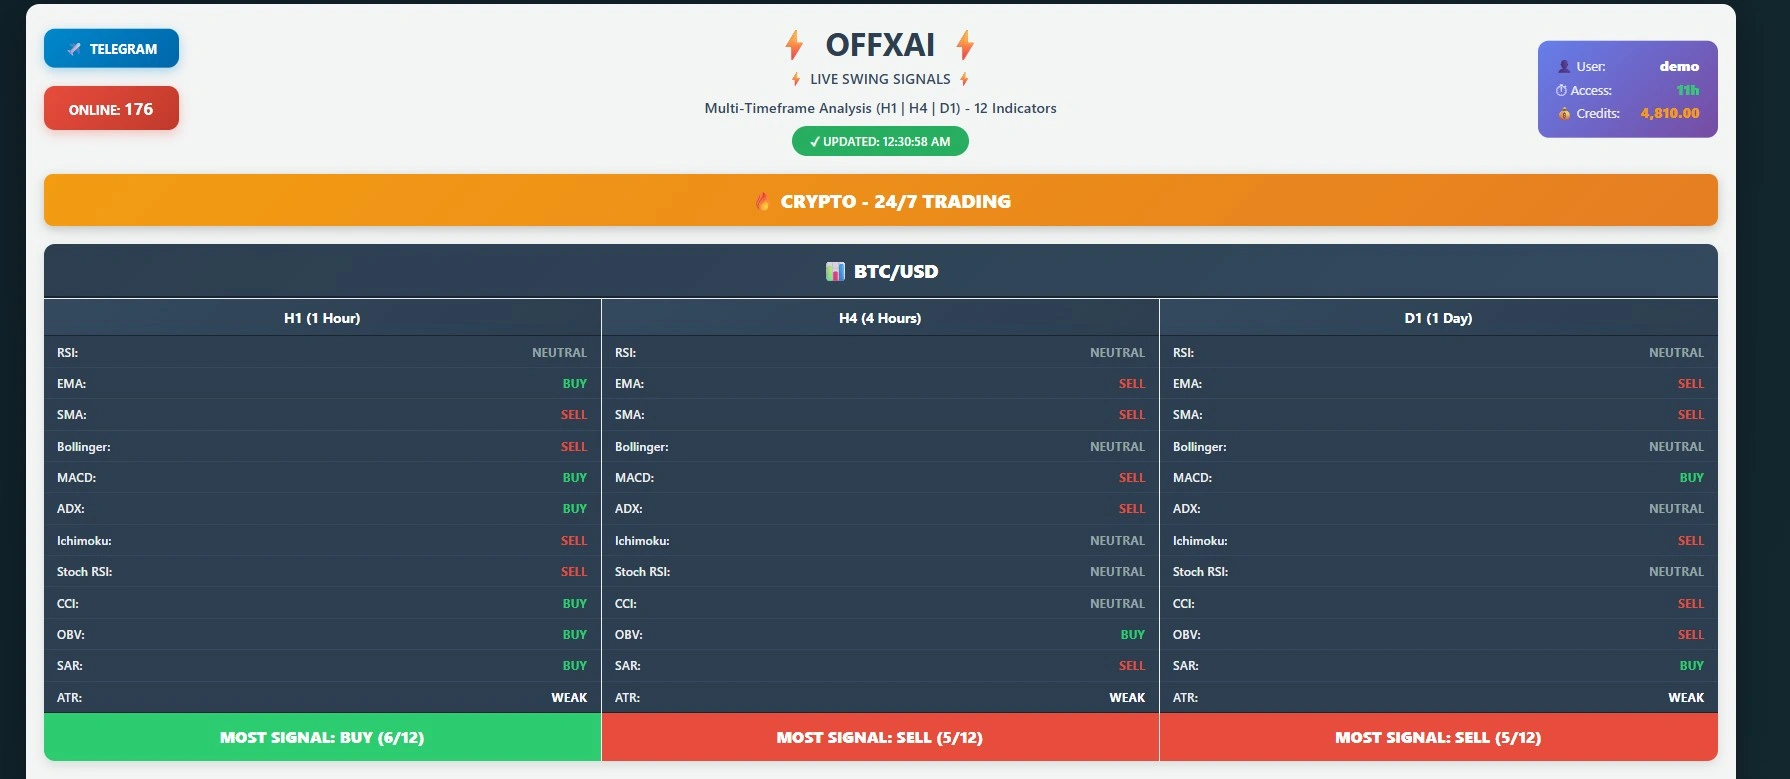
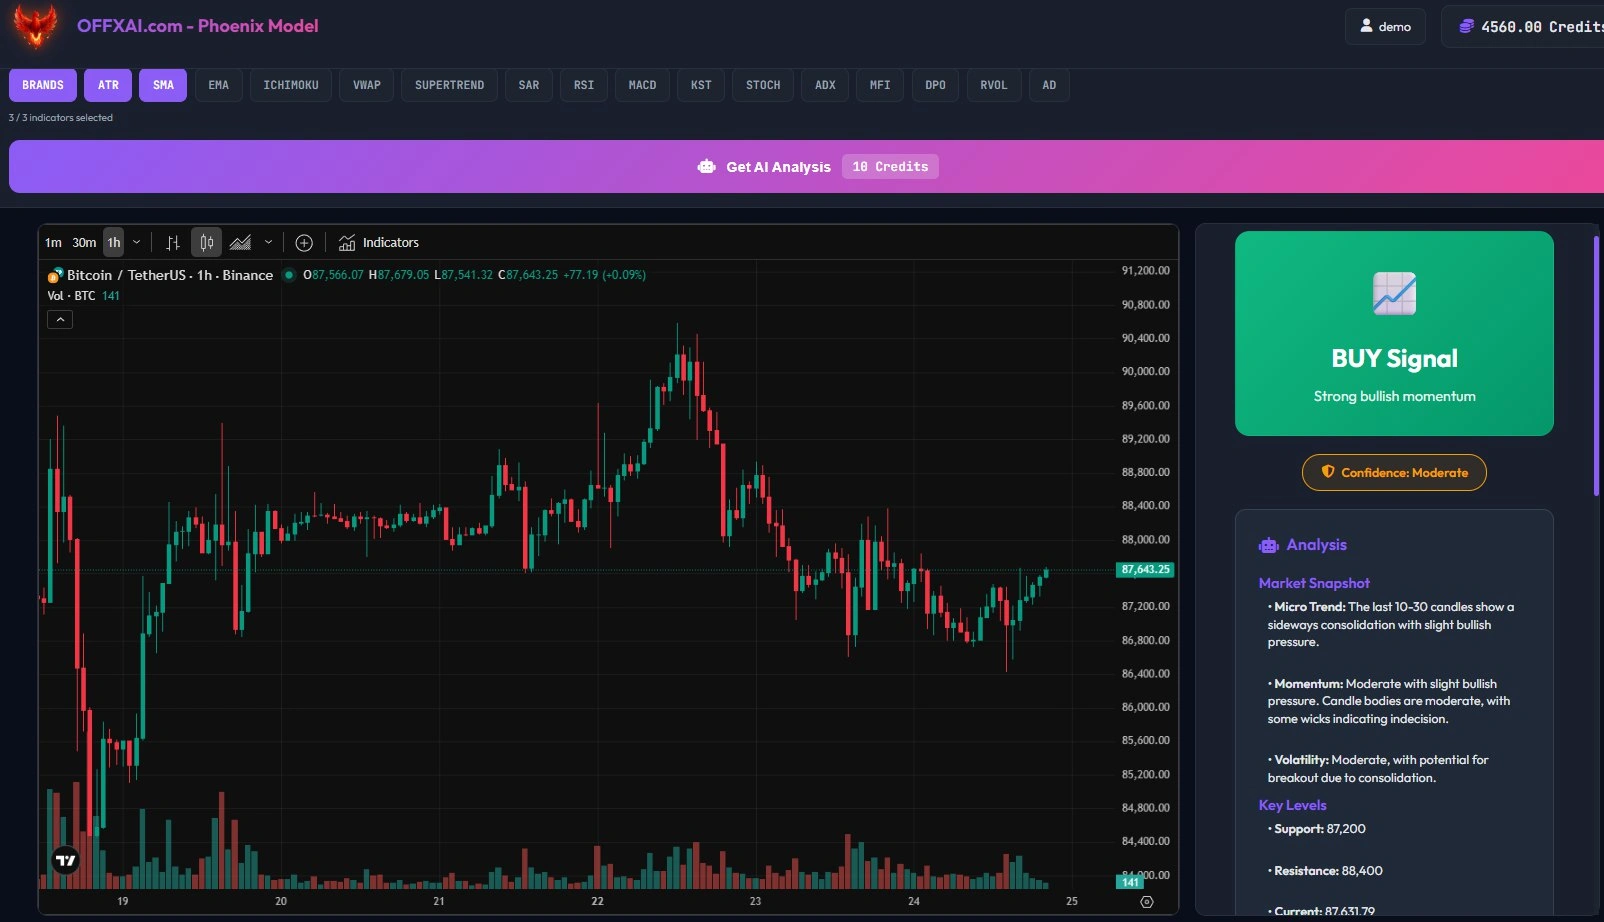
Phoenix Model is OFFXAI’s most comprehensive and flexible chart analysis solution, built for traders who require deep customization and advanced strategic control. As shown in the interface, Phoenix Model allows users to combine multiple trading strategies within a single analysis workflow.
Users can fully customize their analysis by selecting:
Trading pair / Market type / Timeframe / Strategy combination /Analysis language / Up to three technical indicators
How Phoenix Model Works
Phoenix Model enables traders to upload a chart image and apply a custom analysis configuration. The system processes the chart using the selected timeframe, indicators, and strategies, then generates a tailored AI-based analysis output specific to the user’s setup.
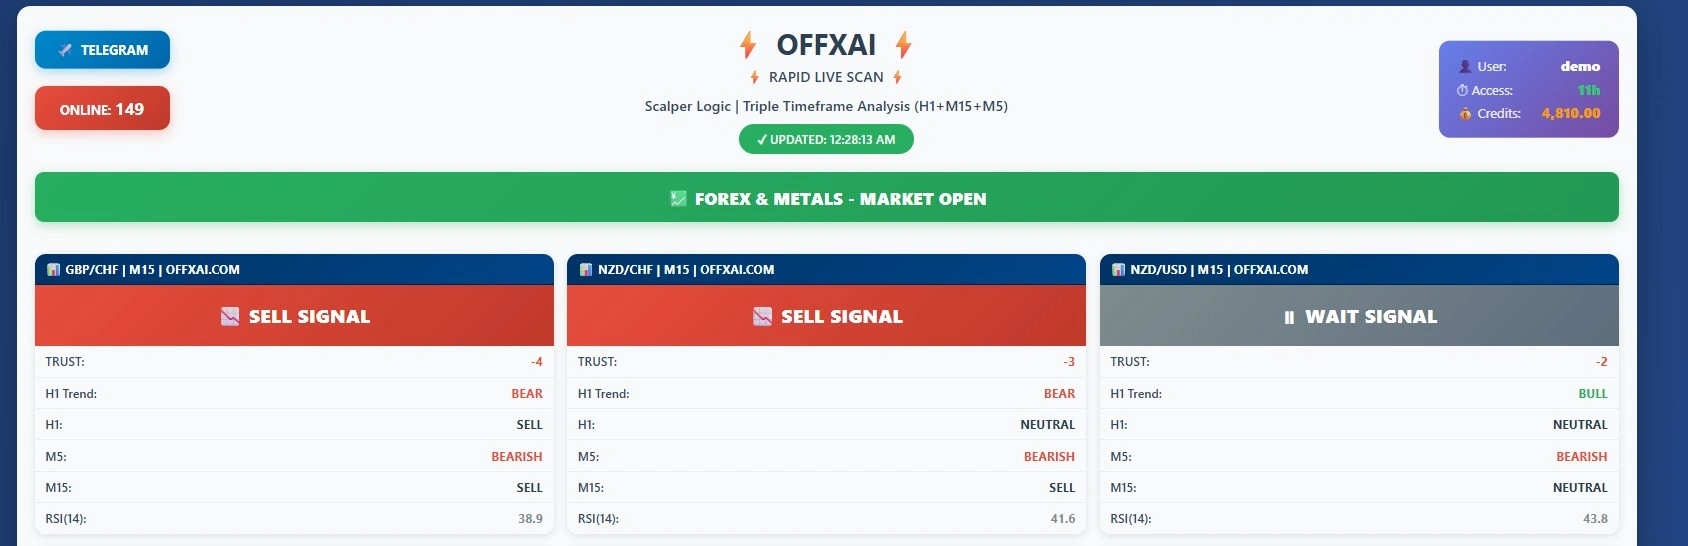
By allowing multiple strategies to work together, Phoenix Model adapts to different trading styles such as scalping, intraday, or hybrid approaches. This makes it suitable for both advanced retail traders and professional users.
Key Benefits of Phoenix Model
Multi-Strategy Analysis within a single model
Custom Timeframe & Trading Pair Selection
Indicator-Based Precision (up to 3 selected indicators)
Image-Based Chart Analysis with AI-generated insights
Language Selection for localized analysis output
Phoenix Model transforms raw chart data into structured, strategy-driven analysis, giving traders clarity and control in complex market conditions.
How to Use? Visual Guide Below
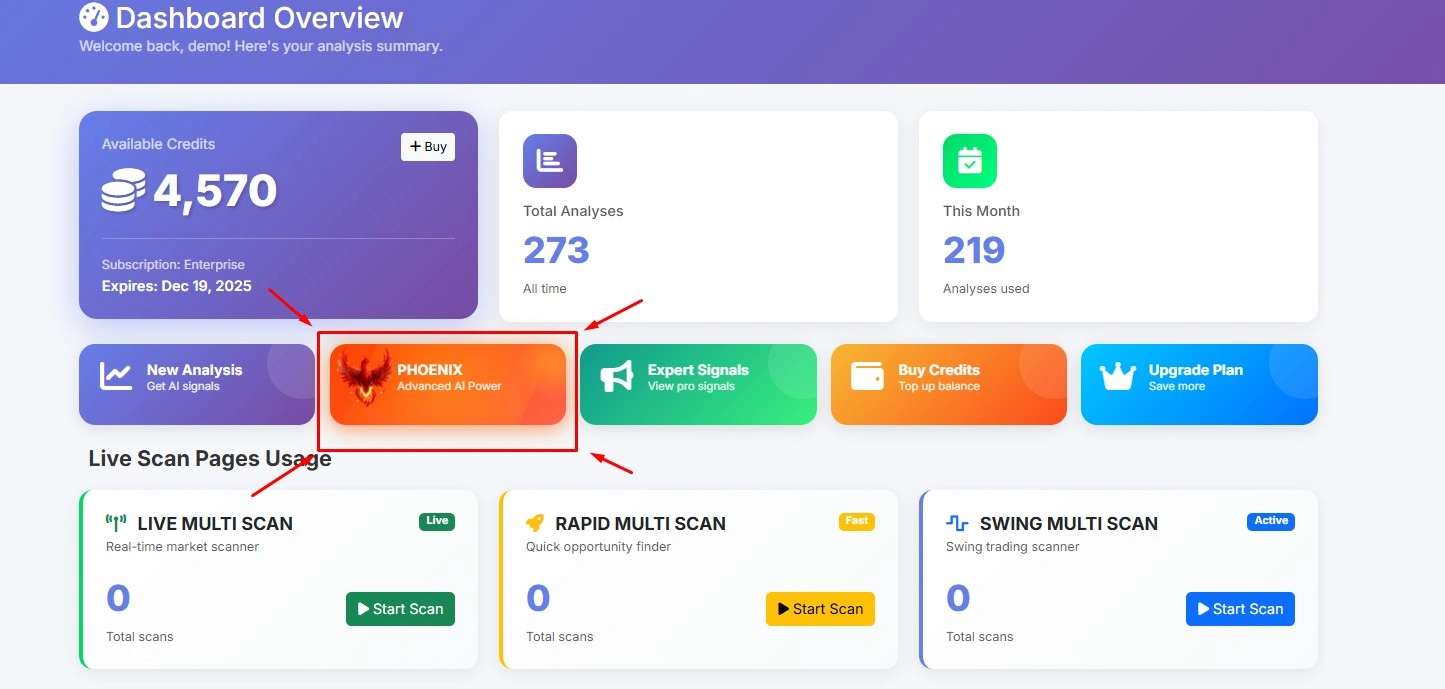
Step-1:
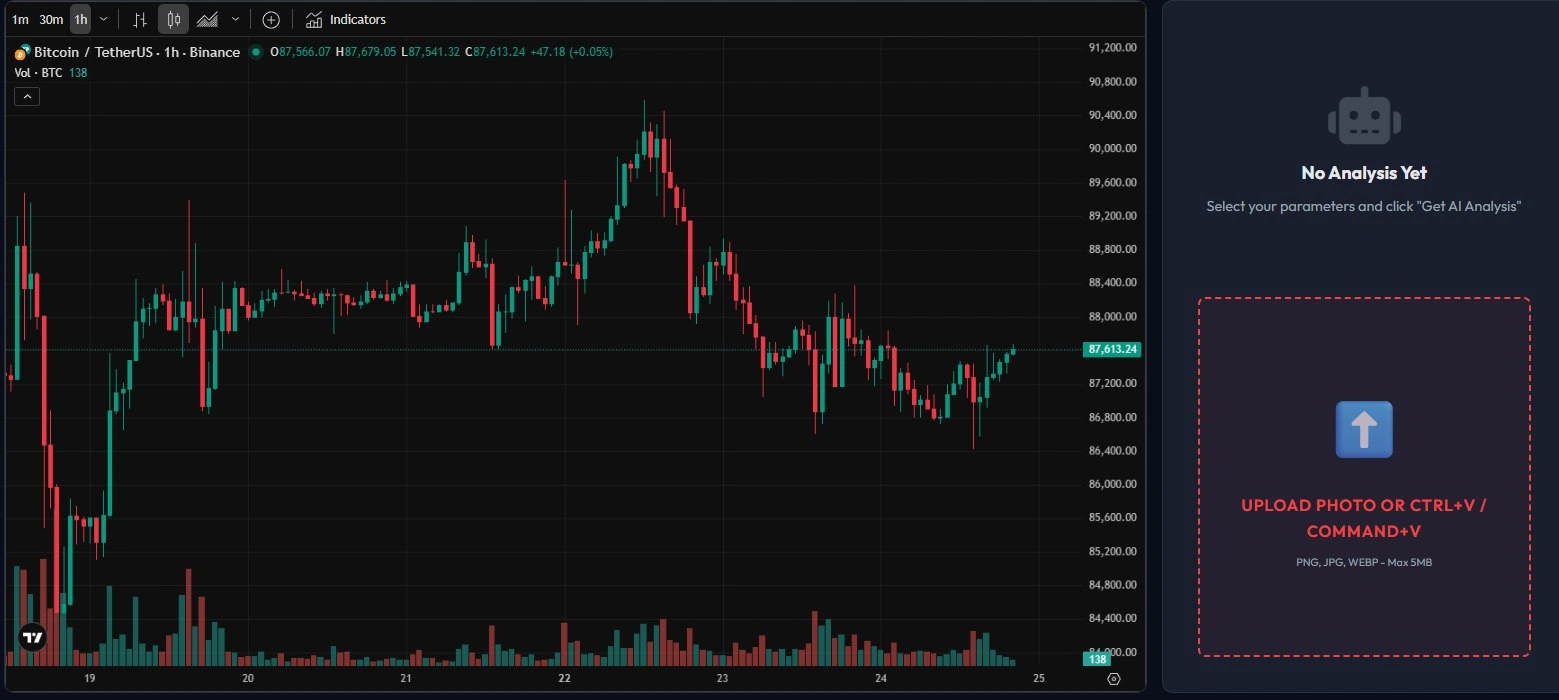
Step-2:The marked areas are for checking the graph below. To make more accurate trades, take a screenshot from within your broker's page. Ensure the graph is clean and clear.
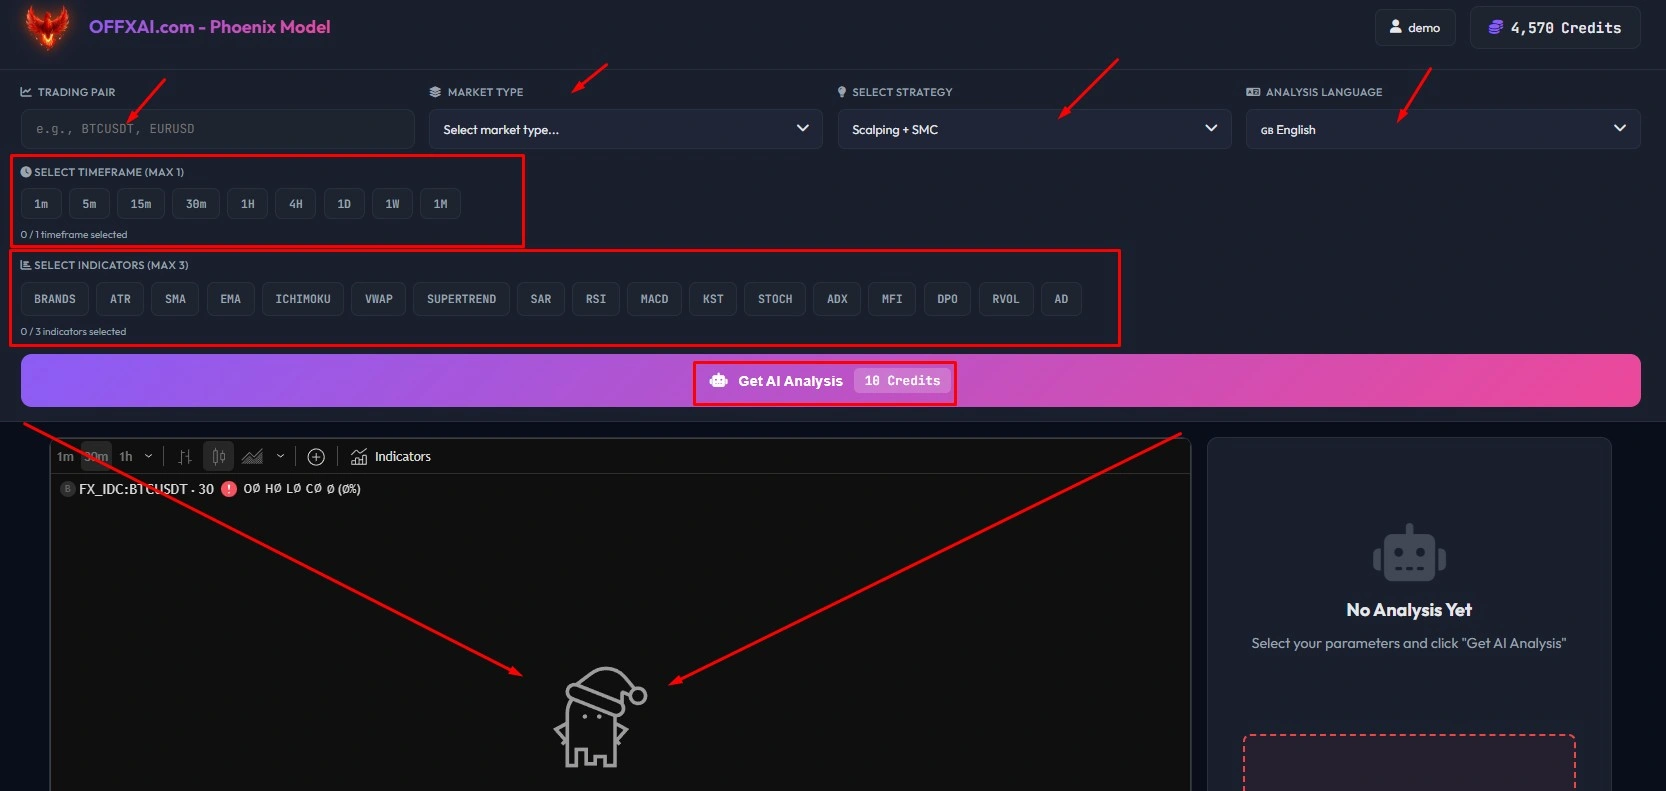
Step-3:Red arrows indicate mandatory fields for general image uploads. Green arrows serve as a tool for users who want to manage the chart below. To perform analysis, simply select the chart image, trading pair name, and strategy.

Step-4: Simply drag and drop your image into the area marked with red squares, or if you've taken a screen recording, you can paste the image into that box using Ctrl+V or Command+V.
Step:5: As you can see in the image below, the analysis was performed and a signal was given. The accuracy rate of the signal is between 85% and 97%, depending on various market conditions.
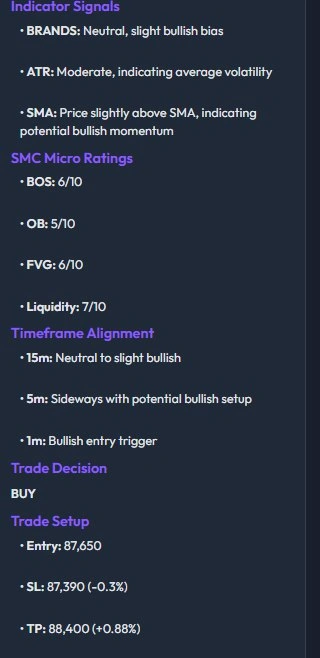
Step-6:Continuation of the analysis. Because this is a very long and detailed analysis, we've only included a specific aspect as an example. A tutorial video will be released on YouTube soon.
Related Articles